FOLLOW THE SCIENCE: PART 5
PITFALLS AND BIASES

Previous posts in this series have dealt with the design of clinical trials to test the efficacy of a treatment and the analysis of data from such trials. (Part 1, Part 2, Part 3 and Part 4). If you haven’t read those I encourage you to do so before reading this section, which will deal with various pitfalls in presenting and analyzing data that can lead to erroneous or misleading conclusions. These pitfalls fall into several broad categories:
· Analysis issues per se
· Biases which render the experimental group and the control group different in important ways that can skew the observed results
· Misleading presentation of data
I. Analysis Issues per se
Imbalance of underlying risk factors
Imbalance of baseline characteristics: When the experimental and control groups are compared, an assumption is made that, except for the difference in treatments, the groups are the same. For any outcome, there are several factors which are known to affect the main outcome. These other factors are known as covariates. For example, if one is studying whether a new drug reduces heart attacks compared to a control it would be important that the percent of subjects within each group who have diabetes is the same, since diabetes is a risk factor for heart attacks. For any clinical trial there are always concomitant conditions that need to be balanced between study groups in order for the results of the trial to be valid. So, when a trial is completed it is essential to make sure that balance of these conditions was obtained. One of the main advantages of prospective, randomized trials is that risk factors tend to be evenly distributed. Aside from known risk factors there may be risk factors that have not been identified yet, so called “unknown unknowns” and randomization makes it unlikely that these unknowns do not occur in one group more frequently than in another group. For a few key underlying conditions that could have a large effect on the outcome it is possible to stratify the randomization so that people with a given condition are randomized separately from those without the condition, which insures balance of that condition.
Not all medical data come from prospective, randomized clinical trials. Studies that rely on data from the past are known as retrospective studies to differentiate them from prospective, randomized trials. Such studies may compare patients who received one treatment to patients who received another treatment (or no treatment at all) at another time, so called historical controls. Conclusions from such studies have to be considered quite tentative since ancillary treatments and the prevalence of other risk factors might differ from one period of time to another.
Another type of retrospective study might compare patients who got one treatment with “matched” patients who did not get the treatment. In this type of analysis a patient who received the treatment is matched to another who is similar in many respects but did not get the treatment. Matching may include finding a control subject paired with each experimental subject of the same gender, age, race and having the same underlying conditions. However, it is not possible to match everything and of course it is not possible to match for the unknown unknowns. Thus, conclusions reached from such studies may be suggestive but always have to be considered tentative at best, unless there is a substantial body of collaborative data from other studies that have the same result.
Even in randomized trials it is possible that some condition is not balanced by random chance (bad luck, so to speak). In both prospective, randomized trials and in retrospective studies there are methods for assessing whether a covariate had an important effect on the study’s outcome and there are rigorous statistical methods for adjusting for the effect an imbalance of a covariate had on the outcome. It is quite acceptable for such methods to be employed in order to make a conclusion more certain, but ideally imbalances do not occur in the first place.
Defining the primary endpoint, multiple comparisons, subset analysis and data dredging
Before any clinical trial is undertaken, it is essential to define what the primary endpoint is. The primary endpoint reflects the main objective of the trial, the one outcome that is most important to the trial. One may also define secondary endpoints which are clinical outcomes of interest but not the most important one. Suppose one is studying whether a new drug reduces a fatal outcome of lung cancer. The new drug is compared to the current standard of care (the control) and the primary endpoint is survival. Secondary endpoints may include a reduction in the size of the cancer and a reduction in the time to progression of the cancer. Recall from previous posts in this series that most trials, in order to confirm that a drug is more effective than the control, require that the observed difference in outcomes might have occurred by chance with a probability of less than one in twenty (p less than 0.05). Now, suppose the primary endpoint, reduction in mortality, did not meet this threshold, but the comparison of time to progression of the tumor did. Can one conclude that the drug is effective in delaying progression. Well, maybe. Why maybe and not yes? Sometimes it is useful to consider extreme examples and then apply that situation to a less extreme one. Suppose one looks at 20 different possible benefits of a drug and the criteria for concluding a difference was caused by the drug requires that the difference could occur by chance in less than 1 in 20 times. If one is looking at 20 different outcomes it is very likely that at least one will be different only by a chance occurrence in 1 in 20. That is, the more outcomes one looks at by making multiple comparisons the more likely it is that any one outcome will occur at a different rate in the experimental and control group by chance and would have had nothing to do with the treatment. In the example of the lung cancer study, by looking at three outcomes one increases the chance of seeing an event by chance alone, not as extreme as looking at 20 outcomes, but instead of having only one way of “winning” one has three ways. You probably know that if one is betting on horses to win a race the payout is higher for the horse to win (only one possible winning outcome) than to “show” (three possible ways to win). That is because the house taking in the bet knows that the probability of a bettor winning in 1 of any 3 ways is higher than the probability of winning only one way. In clinical trials one can test multiple endpoints and “win” on one of them, but one has to make change the level of significance one would have to obtain in order to say the treatment effect was truly different in one study group compared to another; that it did not occur simply by chance. There are generally accepted methods to apply when one wants to make conclusions based on multiple comparisons. For example, if one is testing for two endpoints and showing a difference for either one would be considered a positive trial, the level of significance for each might be p less than 1 in 40 rather than the usual 1 in 20. Requiring that the result for each endpoint is likely to occur by chance alone in 1 of 40 is a more stringent requirement for showing a positive result of a clinical trial and makes up for the increase chance that multiple comparisons could lead to an erroneous conclusion. An example of such a situation might be a clinical trial that is testing a drug to prevent the occurrence of a heart attack or stroke wherein a beneficial effect in either outcome would be considered a positive trial.
An analysis flaw that can occur without having a prospectively defined endpoint (or hypothesis) can occur when, after one examines data on multiple outcomes after the data are collected and, upon seeing a difference in some outcome, one applies a statistical test to see if the difference is “significant.” This searching for differences is known as data dredging. If one makes a number of comparisons some differences will occur by chance and so doing a statistical test retrospectively on something that appears different will give a misleading result. The following example illustrates this point. A man, whose wife just gave birth, walks by the hospital nursery and notices that 90% of the babies are girls. He does a statistical test and finds that this finding is “statistically significant.” He concludes that something about this hospital favors births of females. Clearly this would be a chance event, a fluke, and so his conclusion is wrong. However, after making such an observation he could generate a hypothesis that something about the hospital favors births of girls. He could then design a trial whereby he observes the next 500 births at the hospital. He proposes that the primary endpoint is the proportion of births of female babies compared to male babies. Almost certainly such a prospective study will not yield a significant result, confirming that his retrospective analysis was just a fluke. If, on the other hand, his prospective study showed that a larger fraction of babies born were female then he might investigate further why this is the case. Data dredging may be useful to generate hypotheses that could be tested in a prospective trial, but such dredging should not be used alone to form a conclusion.
Another closely related issue to data dredging and making multiple comparisons is subset analysis. Suppose one is studying the effect of a new drug on a disease in a sample of adults aged 18 - 80. If the overall study did not result in a significant difference in the study population as a whole but did so in a subset of subjects, for example in elderly subjects, one would have to confirm this finding by repeating the trial in elderly patients.
The same principle should be applied to analyzing data on safety. In clinical trial parlance, a side effect is referred to as an adverse event. In the context of a clinical trial, all events that affect a subject’s health are recorded in the data base whether or not the event is thought to be related to the treatments being studied. Literally hundreds of events are recorded. These can range from the trivial, such as hitting one’s finger with a hammer while building something, to the important, such as developing a malignancy. It is reasonable to compare the experimental and control groups with respect to the incidence of the various adverse events that occur. If a large difference exists between groups for a medically important event this may be a signal of something important going on, especially if the event is consistent with the mechanism of action of the drugs being studied; but because so many events are being recorded, the accumulation of more data is usually required to confirm the difference is a real effect of a drug. Nevertheless, unlike efficacy endpoints, large differences in incidence of a medically important adverse event between experimental and control arms are assumed to be real and not just a random effect, in order to minimize harm to patients. Medical judgement as to whether the potential for such risks outweigh the efficacy of the experimental drug is the purview of the practicing physician in consultation with a patient.
II. Biases
There are many biases that one must guard against when considering data from clinical trials, especially from retrospective or observational studies. In general, prospective, randomized, double blind trials prevent of minimize the risk of biases. It is beyond the scope of this review to describe all types of biases that can occur. A few key ones are noted here.
Selection bias: A systemic difference in the baseline characteristics of groups being compared. Suppose one compares the incidence of some disease in people who have gotten annual physical exams to those who haven’t. Suppose one finds that those who get annual exams have less heart attacks than people who do not and then one concludes that annual exams prevent heart attacks. So, what’s the problem with this conclusion? It is likely that people, who by habit get annual exams, do other things that have positive effects on heart health, like eating less red meat (sorry RFK), doing more exercise and maintaining an ideal body weight. Any one of these factors might have resulted in fewer heart attacks rather than the annual physical.
Detection bias: A systemic difference in how an endpoint is measured or in the frequency of detection. Suppose a drug is being compared to placebo as a preventive measure for the progression of disease X. Also suppose that the drug causes headache more frequently than placebo. Those experiencing headache see a physician more frequently than those who don’t which makes it more likely that the physician will also notice the progression of disease earlier than in those not seeking evaluation of the headaches. Thus, it could appear that the drug actually causes progression to occur sooner in the patients receiving the drug compared to those in the placebo group when in fact that is not the case.
Attrition bias: If subjects in one study arm withdraw from a study more frequently than subjects in the other arm the effect of a treatment could be altered because the treatment in one study group is terminated too early, thus interfering with a valid comparison of the two treatments. A similar effect may occur if patients from one study arm are lost to follow up more frequently than in the comparator arm such that the outcome in subjects lost to follow up is not known. This type of bias can occur in randomized trials as well as retrospective or observational studies. There are ways to deal with such data but none is ideal or foolproof. This kind of bias seriously compromises the rigor of any conclusion resulting from a study so affected.
Publication bias: This is not a bias that affects a single trial, but rather it can affect a conclusion one might make when reviewing the published literature about the treatment of a particular disease or about the safety and efficacy of a particular drug or treatment modality. In general, it is easier to get a paper published that reports positive data showing a drug works in a particular disease than a report that the drug was of no benefit. This type of bias, whereby positive studies are published but negative studies aren’t, is particularly a problem when one performs a “meta-analysis.” A meta-analysis is a formal statistical approach that combines data from multiple clinical trials into one data set to assess whether a drug is effective or not. It is mostly employed when there are numerous small studies that on their own do not carry as much weight as a large study investigating the same question would. The problem of publication bias has been mitigated some in recent years because most important medical journals require that a planned study be posted on a website (clinicaltrials.gov) prior to carrying out the study so that negative studies cannot be hidden from the public. The idea is that if the study was not posted on the website prior to its initiation and the study turned out to be positive, the medical journals would not publish the result. Since the organizers and investigators of a clinical trial usually hope to add a publication to their curriculum vitae there is a heavy incentive to post the study to clinicaltrials.gov. As an aside, for people looking for a clinical trial that they may want to enter as a patient, the website can be a resource for searching for relevant trials.
III. Misleading presentation of data
Two common examples of misleading presentation of data are: 1) how data are presented in a graph and 2) when data are reported only as percent improvement.
For graphical representation of data, consider these two bar graphs
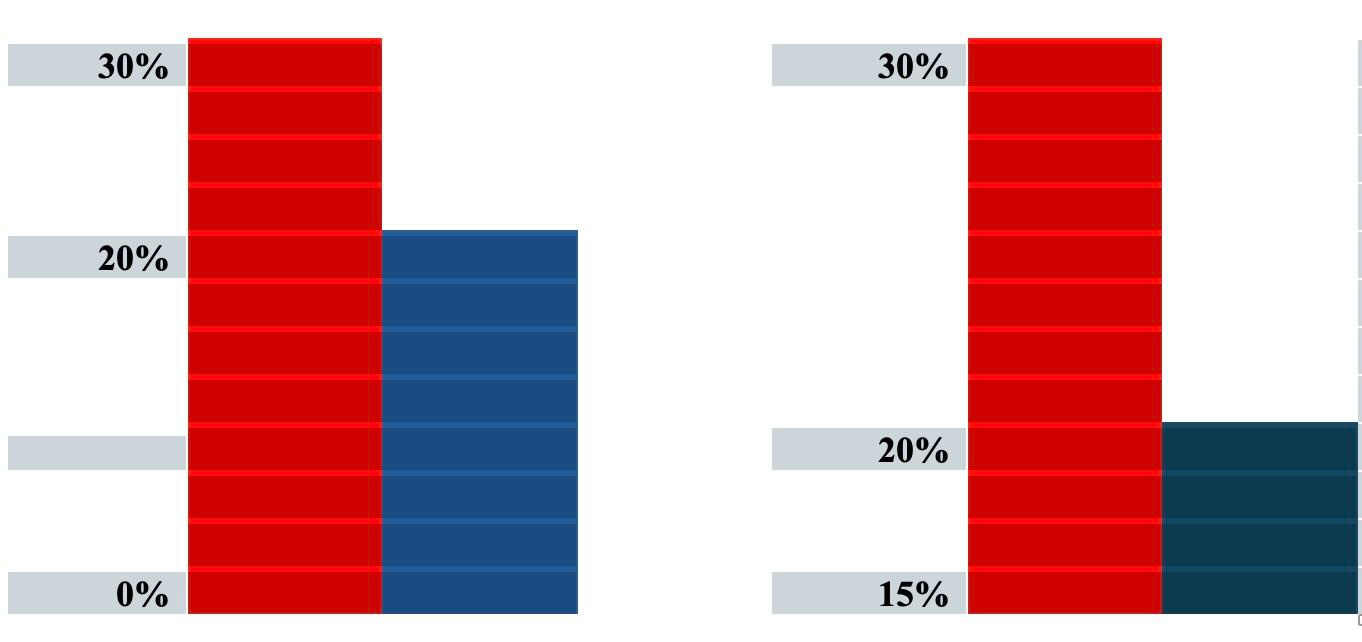
The graphs are representing the same data but the graph on the left uses 0% as the baseline whereas the graph on the right uses 15% as the baseline. The difference between the bars in each graph is 10% but the visual effect of the graph on the right could suggest to the casual observer a larger difference in effect. It is best practice to always use zero as the baseline whenever presenting comparisons of data in a graph.
It is common to report differences in effect of a new treatment compared to a control as a a multiple. For example, a report might say the incidence of hospitalization was doubled in the control group compared to the new treatment. Now compare these two results: 90% of control patients required hospitalization compared to 45% versus 2 % of control patients required hospitalization compared to 1 % of control. Clearly the first example is more important than the second, but in both cases the incidence of hospitalization was doubled in the control group. Thus, it is important, when considering the effect of a new drug, to know the absolute difference and not just the relative difference between the new drug and the control. This incomplete way of reporting a result is common in the press and in announcements (press releases) by pharmaceutical and biotech companies.
Finally, you may see from time to time statements like “There is no evidence that X causes Y.” Be careful. Does this mean that there is a study that shows that X does not cause Y or does it mean that no one has studied this and thus there is no evidence on the subject. Obviously the former case is important whereas the latter is totally uninformative. One of my favorite sayings regarding this issue is “Evidence of absence is not the same as absence of evidence.”
Epilogue: A brief commentary
This installment completes my series on issues in clinical trials and evaluating clinical data. In addition to the specifics covered in the various parts of this series, perhaps even more important is to consider how new data should be evaluated in the context of all data available and how medical treatments and opinions may change as new data emerge. There is a tendency to think that new information is more right than old data and that the practice of medicine should change based on the new data. New data, especially if it contradicts opinions based on prior studies, needs to be considered in the context of the older data. What has changed and why? Perhaps the new result is from a better study, which would give it more weight than would a result from one trial of many, all of which were done well. New data that contradict older data should not automatically lead to a change in medical practice. A careful analysis of why the differences occur is crucial before making a change.
During the Covid epidemic a common mantra of many was “Follow the Science” which, not by chance, was the overall title of this series of postings. But what does follow the science actually mean? Many in the press and many experts who should have known better talked as if science were a static set of dogmatic proclamations. Some imbued their pronouncements with a sense of priestly authority. So, when a recommendation was changed it appeared as if the experts didn’t really know what they were talking about. Trust was lost.
Science and medical practice, based on the results of well designed experiments, is constantly evolving. Rather than saying “the science says such and such” it would be better to say, “based on current evidence the best practice seems to be such and such.” It also behooves the science and medical community to explain in clear terms why they believe one thing or another. The best practice is always subject to change if new data provide a basis for changing practice. It is up to the medical community to provide the public with some estimate of the level of certainly by which they think one thing or another. Scientists should always be open to the possibility that they were wrong and the public should be educated that scientific and medical opinion can change based on the accumulation of new data. Yes, scientists can be wrong. They are not infallible. Old opinions as to best practice need to be reconsidered based on new information, but new information that differs from prior conclusions may or may not dictate a change in practice. Careful consideration of the new data, balanced against the old, is required and this is not an easy task. Intelligent, careful thinkers and practitioners may differ in their approach in how they act on new information. However, practice should not be an exercise of opinion derived from preconceived notions, “gut feelings” or based on prejudice, but rather from a rigorous appraisal of all data that are derived from well done studies. Just as important, medical experts and health officials should focus on explaining to the public in concise, simple terms why they think one thing or another.
This concludes my series on issues related to developing medical information from clinical trials and other techniques of investigation. I hope you have found it useful. Please do not hesitate to ask questions in the comments if there are still issues that are not clear, and I will do my best to answer them.
Stay tuned for future posts on a broad range of topics that pique my interest, and if you are new to my blog, there are a number of posts from the past that you can access here on substack.
I really enjoyed reading this. In particular, I was unaware of the clinical trials website, which helps to monitor drug companies when they do not publish negative studies.
Really enjoyed this article. The fact is, such intellectual inquiry and analysis does not occur in my everyday life, and hasn't for many years now. So it kind of brought me back to my academic years and reminded me about the excitement of thoughtful stimulation!!!! Thanks, Rick! tina